2018年6月統計検定2級の問題の解説(その2)
2018/06/24
カテゴリ:統計検定
タグ:2018年6月
※統計検定2級 解説記事一覧はこちら※
下記のリンクからそれぞれの問題の解説に飛ぶことができます。
問7 [13]
腕相撲に2連勝した時点でお菓子をもらうことができます。「T君ーU君ーT君」の順で対戦するとき、お菓子をもらうことができるのは、「①初めの2試合で連勝」、もしくは「②1試合目に負け、残り2試合で連勝」のどちらかです。
①のとき:p×q=pq
②のとき:(1-p)×q×p=(1-p)qp
したがってS君がお菓子を獲得する確率は①と②を足してpq+(1-p)qpとなります。
問7 [14]
「U君ーT君ーU君」の順で対戦するとき、お菓子をもらうことができるのは、「①初めの2試合で連勝」、もしくは「②1試合目に負け、残り2試合で連勝」のどちらかです。
①のとき:q×p=pq
②のとき:(1-q)×p×q=(1-p)qp
したがってS君がお菓子を獲得する確率は①と②を足してpq+(1-q)qpとなります。p<qなので、 pq+(1-q)qpのほうが[13]で算出したpq+(1-p)qpよりも小さくなります。したがって、「T君ーU君ーT君」の方がお菓子獲得の確率は高くなります。
問8 [15]
データを標準化することで、標準化した値から標準正規分布を使って確率を求めることができます。標準化した値はあるデータから平均を引いたものを標準偏差で割ることで求められます。
この問題で求める確率は次の確率です。
![Rendered by QuickLaTeX.com \displaystyle P \left(Z > \frac{4800-4000}{500} \right) = P (Z>1.6)](https://bellcurve.jp/statistics/wp-content/ql-cache/quicklatex.com-ed8e7a526e7337142f428e7792edda53_l3.png)
標準正規分布表より、Zが1.6を超える確率は0.0548であることが分かります。
問8 [16]
この問題も[15]と同様に標準正規分布を用いて考えます。ただし、2つの確率変数の「差」の分布を考えなければならない点に注意が必要です。
ある年の6月の電気料金と前年の6月の電気料金との差が800円以上となる確率を求めます。
![Rendered by QuickLaTeX.com \displaystyle P \left(Z > \frac{800}{\sqrt{\sigma^2}} \right) = P \left(Z > \frac{800}{\sqrt{500^2+500^2}} \right) = P (Z>1.13)](https://bellcurve.jp/statistics/wp-content/ql-cache/quicklatex.com-198c405cce4a8d8f0b69fdb873a05c7c_l3.png)
2つの確率変数が独立であるとき、確率変数の差の分散はそれぞれの確率変数の分散の和に等しくなります。したがって、となります。
標準正規分布表より、Zが1.13を超える確率は0.1292であることが分かります。
問8 [17]
一見難しそうに見えますが、実はシンプルな問題です。
ある年の6月の電気料金をa、前年の6月の電気料金をb、前々年の6月の電気料金をcをします。これらはいずれも平均4000円、標準偏差500円の独立で同一の正規分布に従います。
したがって、a、b、cの大小関係は次の6パターンが考えられ、いずれも等しい確率で起こります。
- a<b<c
- a<c<b
- b<a<c
- b<c<a
- c<a<b
- c<b<a
これらのうち、aが最も大きくなるのは6パターン中2パターンのみなので、確率は2/6=1/3=0.333となります。
問9 [18]
確率変数の2乗の期待値を求める場合には、次の式を使います。
![Rendered by QuickLaTeX.com \displaystyle V(X)=E(X^2)-\left\{E(X)\right\}^2](https://bellcurve.jp/statistics/wp-content/ql-cache/quicklatex.com-b9556f22af81b5dae3ad92812e423ed9_l3.png)
この式を使うと、
![Rendered by QuickLaTeX.com \displaystyle 1.0= E(X^2)-4.0 \Longrightarrow E(X^2)=5.0](https://bellcurve.jp/statistics/wp-content/ql-cache/quicklatex.com-3619af230c90a5c32e593e1a2980e1a0_l3.png)
![Rendered by QuickLaTeX.com \displaystyle 1.0= E(Y^2)-9.0 \Longrightarrow E(Y^2)=10.0](https://bellcurve.jp/statistics/wp-content/ql-cache/quicklatex.com-000dcb00fc3da896cad9b6a7c2abc08b_l3.png)
となります。
問9 [19]
共分散は次の式から算出できます。
![Rendered by QuickLaTeX.com \displaystyle Cov(U, V)=E(UV)-E(U)E(V)](https://bellcurve.jp/statistics/wp-content/ql-cache/quicklatex.com-dcaf88a5564ffafc5917de1263f7c724_l3.png)
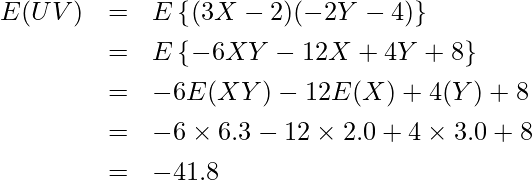
E(U, V)、E(U)、E(V)を求めます。
![Rendered by QuickLaTeX.com \displaystyle E(U)=E(3X-2)=3E(X)-2=3 \times 2.0-2=4.0](https://bellcurve.jp/statistics/wp-content/ql-cache/quicklatex.com-45ad0b975cba5f5d90c5d68cd2ff3d3d_l3.png)
![Rendered by QuickLaTeX.com \displaystyle E(V)=E(-2Y-4)=-2E-4=−2 \times 3.0-4=-10.0](https://bellcurve.jp/statistics/wp-content/ql-cache/quicklatex.com-f3411ed9bb7083c4acde9560f6839bd5_l3.png)
したがって、
![Rendered by QuickLaTeX.com \displaystyle Cov(U, V)=-41.8-4.0 \times (-10.0)=-1.8](https://bellcurve.jp/statistics/wp-content/ql-cache/quicklatex.com-2f18a9608215bcc32af3ce54b76bcd1f_l3.png)
また、相関係数rは次の式から算出できます。
![Rendered by QuickLaTeX.com \displaystyle r=\frac{Cov(U, V)}{\sqrt{V(U)V(V)}}](https://bellcurve.jp/statistics/wp-content/ql-cache/quicklatex.com-5d3c63d27fc586a637021bafde55bb45_l3.png)
V(U)、V(V)を求めます。
![Rendered by QuickLaTeX.com \displaystyle V(U)=V(3X-2)=9V(X)=9.0](https://bellcurve.jp/statistics/wp-content/ql-cache/quicklatex.com-0dd94826095b8fb0d61bf3d44ad92d51_l3.png)
![Rendered by QuickLaTeX.com \displaystyle V(V)=V(-2Y-4)=4V(Y)=4.0](https://bellcurve.jp/statistics/wp-content/ql-cache/quicklatex.com-d8f9b8254dbfdb69e3cf00f2be024a0a_l3.png)
したがって、
![Rendered by QuickLaTeX.com \displaystyle r=\frac{Cov(U, V)}{\sqrt{V(U)V(V)}}=\frac{-1.8}{\sqrt{9.0 \times 4.0}}=-0.3](https://bellcurve.jp/statistics/wp-content/ql-cache/quicklatex.com-ea101c029067ffd677ae1ca91f94487c_l3.png)
問10 [20]
やや難しかった問題です。まず、の両辺を
で割ります。
![Rendered by QuickLaTeX.com \displaystyle P \left(-\frac{0.5}{\sqrt{\frac{\sigma^2}{n}}} \leq \frac{\bar{X}-\mu}{\sqrt{\frac{\sigma^2}{n}}} \leq \frac{0.5}{\sqrt{\frac{\sigma^2}{n}}} \right) \geq 0.95](https://bellcurve.jp/statistics/wp-content/ql-cache/quicklatex.com-f4a922183f6f0c6920dcce9f6c7b0d36_l3.png)
なので、
![Rendered by QuickLaTeX.com \displaystyle P \left(-0.5 \sqrt{n} \leq \sqrt{n}(\bar{X}-\mu) \leq 0.5 \sqrt{n} \right) \geq 0.95](https://bellcurve.jp/statistics/wp-content/ql-cache/quicklatex.com-27c49f78d64c983e8cf2a3c3fedd5dd4_l3.png)
標準正規分布表より、上側2.5%点は「1.96」なので、となればよいことが分かります。これを解いて
![Rendered by QuickLaTeX.com \displaystyle n \geq 15.3664](https://bellcurve.jp/statistics/wp-content/ql-cache/quicklatex.com-ac82e996ffd39b95538e87445cf28e7c_l3.png)
となり、最小の標本サイズは16となります。
問10 [21]
母平均μの信頼区間は次の式から算出します。
![Rendered by QuickLaTeX.com \displaystyle \bar{X}-t_{\alpha/2}(n-1) \times \sqrt{\frac{S^2}{n}} \leq \mu \leq \bar{X}+t_{\alpha/2}(n-1) \times \sqrt{\frac{S^2}{n}}](https://bellcurve.jp/statistics/wp-content/ql-cache/quicklatex.com-cd9c391f41c9cc548f4dfae95740e2d0_l3.png)
nはサンプルサイズ、は不偏分散、
は自由度が(n-1)のt分布における上側確率が
となるt値を表します。
与えられた値を入れると次のようになります。
![Rendered by QuickLaTeX.com \displaystyle 10.50-2.093 \times \sqrt{\frac{5.41}{20}} \leq \mu \leq 10.50+2.093 \times \sqrt{\frac{5.41}{20}}](https://bellcurve.jp/statistics/wp-content/ql-cache/quicklatex.com-491283ea064da72efbb6076ca64d47c3_l3.png)
問11 [22]
母比率pの95%信頼区間は次の式から算出します。
![Rendered by QuickLaTeX.com \displaystyle \widehat{p}-1.96 \times \sqrt{\frac{\widehat{p}(1-\widehat{p})}{n}} \leq p \leq \widehat{p}+1.96 \times \sqrt{\frac{\widehat{p}(1-\widehat{p})}{n}}](https://bellcurve.jp/statistics/wp-content/ql-cache/quicklatex.com-06a910160f478e92ff6e99546a19d89d_l3.png)
は標本比率を表します。この問題では
=0.071です。与えられた値を入れると次のようになります。
![Rendered by QuickLaTeX.com \displaystyle 0.071-1.96 \times \sqrt{\frac{{0.071}(1-0.071)}{4633}} \leq p \leq 0.071+1.96 \times \sqrt{\frac{{0.071}(1-0.071)}{4633}}](https://bellcurve.jp/statistics/wp-content/ql-cache/quicklatex.com-95f5b0642c33f34111b8cc539ca88d6b_l3.png)
![Rendered by QuickLaTeX.com \displaystyle 0.071-0.007 \leq p \leq 0.071+0.007](https://bellcurve.jp/statistics/wp-content/ql-cache/quicklatex.com-dfc3e420d0243196615098d865f2ad24_l3.png)
問11 [23]
真面目に解くととてもめんどくさいですが、実は消去法で行くと答えがあっさり分かるという問題でした。
母比率の推定値は、15歳以上の推定人口に占める野球の行動者の人数の割合です。北海道と沖縄の15歳以上の合計推定人口は、
![Rendered by QuickLaTeX.com \displaystyle N_1+N_2](https://bellcurve.jp/statistics/wp-content/ql-cache/quicklatex.com-2a98bddae896a9b922052f1a76f2b711_l3.png)
であり、野球行動者の合計人数は
![Rendered by QuickLaTeX.com \displaystyle N_1\widehat{p}_1+N_2\widehat{p}_2](https://bellcurve.jp/statistics/wp-content/ql-cache/quicklatex.com-d7f60853d7c2af69a27b27dd3d5914df_l3.png)
となります。したがって母比率の推定値は次のように計算できます。
![Rendered by QuickLaTeX.com \displaystyle \frac{N_1\widehat{p}_1+N_2\widehat{p}_2}{N_1+N_2}](https://bellcurve.jp/statistics/wp-content/ql-cache/quicklatex.com-8559d939f7747b594012a85523c8c449_l3.png)
母比率の推定値の標準誤差を求めるにあたっては、まず分散を求めます。
![Rendered by QuickLaTeX.com \displaystyle V\left[ \frac{N_1\widehat{p}_1+N_2\widehat{p}_2}{N_1+N_2} \right] = V\left[ \frac{N_1\widehat{p}_1}{N_1+N_2} + \frac{N_2\widehat{p}_2}{N_1+N_2}\right]](https://bellcurve.jp/statistics/wp-content/ql-cache/quicklatex.com-04efb0cb37849f56839a9f2584d6a875_l3.png)
と
は独立なので、
の分散は
で算出できるので、
![Rendered by QuickLaTeX.com \displaystyle V\left[ \frac{N_1\widehat{p}_1+N_2\widehat{p}_2}{N_1+N_2} \right] = \left( \frac{N_1}{N_1+N_2} \right)^2 \frac{\widehat{p}_1(1-\widehat{p}_1)}{n_1} + \left( \frac{N_2}{N_1+N_2} \right)^2 \frac{\widehat{p}_2(1-\widehat{p}_2)}{n_2}](https://bellcurve.jp/statistics/wp-content/ql-cache/quicklatex.com-9a42788932fe8d9a2e447bc3df0498b6_l3.png)
となり、標準誤差は平方根をとったものになります。