- Step2. 中級編
- 5. 統計的検定
5-1. 適合度検定
■適合度検定
25-4章で適合度の検定について学びました。適合度検定とは、度数分布表において実測度数と理論度数が一致するかどうかを検定する方法で、カイ二乗分布を使って検定を行います。
ここでは次の表に示すように、実測値f、理論確率p、総実測数nを用いた2×2のクロス集計表について考えてみます。
カテゴリーC | ![]() | ![]() | 合計 |
---|---|---|---|
実測値 | ![]() | ![]() | n |
理論確率 | ![]() | ![]() | 1 |
理論値 | ![]() | ![]() | n |
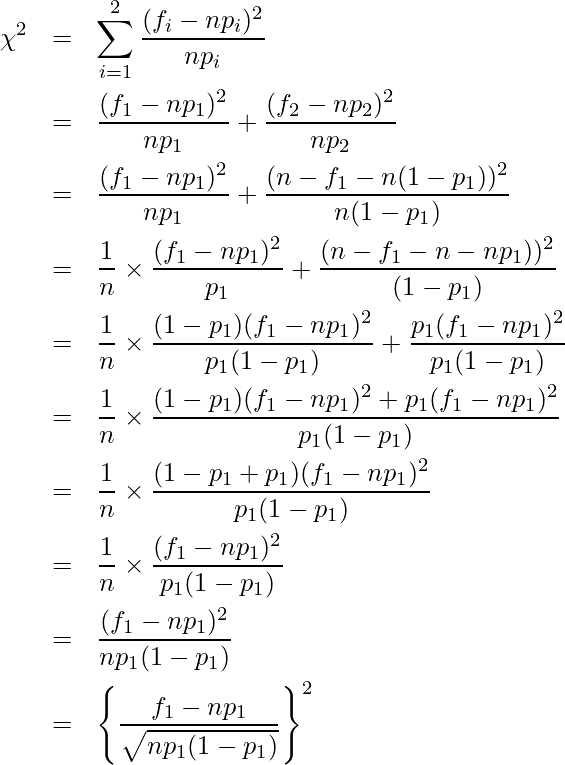
このとき、次の式で表されるカイ二乗値は自由度1のカイ二乗分布に従います。
![Rendered by QuickLaTeX.com \displaystyle \chi^2 = \sum^{2}_{i=1}{\frac{(f_i-np_i)^2}{np_i}}](https://bellcurve.jp/statistics/wp-content/ql-cache/quicklatex.com-55b4e0a46753f9a1a65fc9e482cb290d_l3.png)
この式を展開すると、
![Rendered by QuickLaTeX.com p_1](https://bellcurve.jp/statistics/wp-content/ql-cache/quicklatex.com-023bcfb3fa329ff4f481163d36b65bf9_l3.png)
![Rendered by QuickLaTeX.com C_1](https://bellcurve.jp/statistics/wp-content/ql-cache/quicklatex.com-91744e8fbe4acfee0cfa3c783ee4ce21_l3.png)
![Rendered by QuickLaTeX.com f_1](https://bellcurve.jp/statistics/wp-content/ql-cache/quicklatex.com-8fabe9c4cdf7ee8660feb773060f31ec_l3.png)
![Rendered by QuickLaTeX.com p_1](https://bellcurve.jp/statistics/wp-content/ql-cache/quicklatex.com-023bcfb3fa329ff4f481163d36b65bf9_l3.png)
![Rendered by QuickLaTeX.com Bi(n, p_1)](https://bellcurve.jp/statistics/wp-content/ql-cache/quicklatex.com-26776a11f37cce6d2034a1e242c77fc6_l3.png)
![Rendered by QuickLaTeX.com Bi(n, p1)](https://bellcurve.jp/statistics/wp-content/ql-cache/quicklatex.com-f5df29e8910fab411dfc1c7571673cfe_l3.png)
![Rendered by QuickLaTeX.com np_1](https://bellcurve.jp/statistics/wp-content/ql-cache/quicklatex.com-88882d5232fa115dd8c3c8187875928c_l3.png)
![Rendered by QuickLaTeX.com np_1(1−p_1)](https://bellcurve.jp/statistics/wp-content/ql-cache/quicklatex.com-6d2b8d438b3b99da3c06074531feea06_l3.png)
![Rendered by QuickLaTeX.com \displaystyle \frac{f_1-np_1}{\sqrt{np_1(1-p_1)}}](https://bellcurve.jp/statistics/wp-content/ql-cache/quicklatex.com-d1dc76876efdc0d4fec073662b07549d_l3.png)
22-1章で学んだように、標準正規分布の二乗和はカイ二乗分布に従うことから、は自由度1のカイ二乗分布に従います。